[译]用 Bottle 开发
![]()
我喜欢 bottle。它是一个简单、快速且功能强大的 Python 微框架,非常适合小型 Web 应用程序和快速原型设计。对于那些刚刚开始 Web 开发的人来说,它也是一个出色的学习工具。
让我们看一个简单的例子。
注意:本教程假设您正在运行基于 Unix 的环境 - 例如 Mac OS X、Linux 版本或通过虚拟机支持的 Linux 版本。
06/13/2015 更新:更新了代码示例和解释。
启动
首先,让我们创建一个工作目录:
$ mkdir bottle && cd bottle
接下来,您需要安装 pip、virtualenv 和 git。
virtualenv 是一个 Python 工具,可以轻松管理特定项目所需的 Python 包;它可以防止一个项目中的包与其他项目中的包发生冲突。同时,pip 是一个包管理器,用于管理 Python 包的安装。
如需在 Unix 环境中安装 pip(及其依赖项)的帮助,请按照 此 Gist 中的说明进行操作。如果您使用的是 Windows 环境,请观看此视频以获取帮助。
安装 pip 后,运行以下命令来安装 virtualenv:
$ pip install virtualenv==12.0.7
现在我们可以轻松设置本地环境:
$ virtualenv venv
$ source venv/bin/activate
安装 bottle:
$ pip install bottle==0.12.8
$ pip freeze > requirements.txt
最后,让我们使用 Git 将我们的应用程序置于版本控制之下。有关 Git 的更多信息,请 查看本文,其中还包括安装说明。
编写你的应用程序
我们准备好编写我们的瓶子应用程序了。打开 Sublime Text 3 或您选择的文本编辑器。创建您的应用程序文件 app.py,它将保存我们第一个应用程序的全部内容:
import os
from bottle import route, run, template

index_html = '''My first web app! By <strong>{{ author }}</strong>.'''


@route('/')
def index():
    return template(index_html, author='Real Python')


@route('/name/<name>')
def name(name):
    return template(index_html, author=name)


if __name__ == '__main__':
    port = int(os.environ.get('PORT', 8080))
    run(host='0.0.0.0', port=port, debug=True)
保存文件。
现在您可以在本地运行您的应用程序:
$ python app.py
您应该能够连接到 http://localhost:8080/ 并看到您的应用程序正在运行!
My first web app! By RealPython.
因此, @route 装饰器将一个函数绑定到路由。在第一个路由 / 中, index() 函数绑定到该路由,该路由渲染 index_html 模板并传入变量 author 作为关键字参数。然后可以在模板中访问该变量。
现在导航到下一条路由,确保在路由末尾添加您的名字 - 即 http://localhost:8080/name/Michael。您应该看到类似以下内容:
My first web app! By Michael.
这是怎么回事?
同样,
@route装饰器将一个函数绑定到路由。在本例中,我们使用包含通配符<name>的动态路由。然后,该通配符作为参数传递给视图函数 -
def name(name)。然后我们将其作为关键字参数传递给模板 -
author=name然后模板渲染作者变量 -
{{ author }}。
Shell 脚本
想快速入门吗?使用此 Shell 脚本在几秒钟内生成入门应用程序。
mkdir bottle
cd bottle
pip install virtualenv==12.0.7
virtualenv venv
source venv/bin/activate
pip install bottle==0.12.8
pip freeze > requirements.txt
git init
git add .
git commit -m "initial commit"

cat >app.py <<EOF
import os
from bottle import route, run, template

index_html = '''My first web app! By <strong>{{ author }}</strong>.'''


@route('/')
def index():
    return template(index_html, author='Real Python')


@route('/name/<name>')
def name(name):
    return template(index_html, author=name)


if __name__ == '__main__':
    port = int(os.environ.get('PORT', 8080))
    run(host='0.0.0.0', port=port, debug=True)
EOF

chmod a+x app.py

git init
git add .
git commit -m "Updated"
从此要点下载此脚本,然后使用以下命令运行它:
$ bash bottle.sh
下一步
从这一点来看,创建新页面就像添加新的 @route 装饰函数一样简单。
创建 HTML 很简单:在上面的应用程序中,我们只是将 HTML 内联到文件本身中。修改它以从文件加载模板很容易。例如:
@route('/main')
def main(name):
    return template('main_template')
这将加载模板文件 main_template.tpl ,该文件必须放置在项目结构中的 views 文件夹中,并将其呈现给最终用户。
有关详细信息,请参阅 bottle 文档。
基本设置
首先从第 1 部分下载此 Gist,然后使用以下命令运行它:
$ bash bottle.sh
这将创建一个基本的项目结构:
├── app.py
├── requirements.txt
└── testenv
激活虚拟环境:
$ cd bottle
$ source testenv/bin/activate
安装要求:
$ pip install -r requirements.txt
导航到 https://www.plot.ly/api,注册一个新帐户,登录,然后创建一个新的 API 密钥:
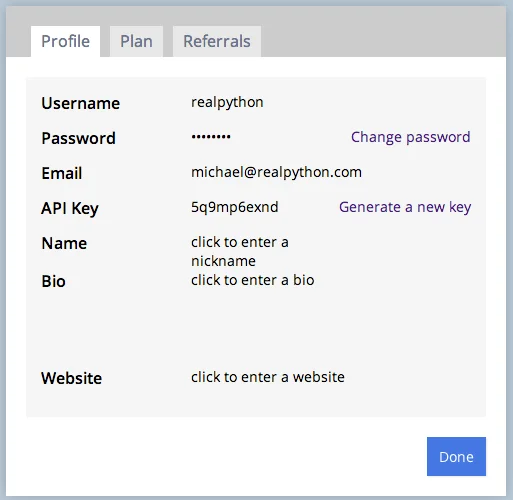
复制该密钥。
安装 plot.ly:
$ pip install plotly==1.2.6
接下来更新 app.py 中的代码:
import os
from bottle import run, template, get, post, request

import plotly.plotly as py
from plotly.graph_objs import *


# add your username and api key
py.sign_in("realpython", "lijlflx93")


@get('/plot')
def form():
    return '''<h2>Graph via Plot.ly</h2>
              <form method="POST" action="/plot">
                Name: <input name="name1" type="text" />
                Age: <input name="age1" type="text" /><br/>
                Name: <input name="name2" type="text" />
                Age: <input name="age2" type="text" /><br/>
                Name: <input name="name3" type="text" />
                Age: <input name="age3" type="text" /><br/>
                <input type="submit" />
              </form>'''


@post('/plot')
def submit():
    # grab data from form
    name1 = request.forms.get('name1')
    age1 = request.forms.get('age1')
    name2 = request.forms.get('name2')
    age2 = request.forms.get('age2')
    name3 = request.forms.get('name3')
    age3 = request.forms.get('age3')

    data = Data([
        Bar(
            x=[name1, name2, name3],
            y=[age1, age2, age3]
        )
    ])

    # make api call
    response = py.plot(data, filename='basic-bar')

    if response:
        return template('''
            <h1>Congrats!</h1>
            <div>
              View your graph here: <a href="{{response}}"</a>{{response}}
            </div>
            ''',
            response=response
        )

if __name__ == '__main__':
    port = int(os.environ.get('PORT', 8080))
    run(host='0.0.0.0', port=port, debug=True)
这里发生了什么?
- 第一个函数
form()创建一个 HTML 表单,用于捕获制作简单条形图所需的数据。 - 与此同时,第二个函数
submit()抓取表单输入,将它们分配给变量,然后调用 plot.ly API,传递我们的凭据和数据,以生成新图表。确保将我的用户名和 API 密钥替换为您自己的凭据。不要使用我的。不起作用。
测试
在本地运行您的应用程序, python app.py ,并将浏览器指向 http://localhost:8080/plot。
输入三个人的姓名及其各自的年龄。按“提交”,如果一切顺利,您应该会看到一条祝贺消息和一个 URL。单击 URL 查看您的图表:
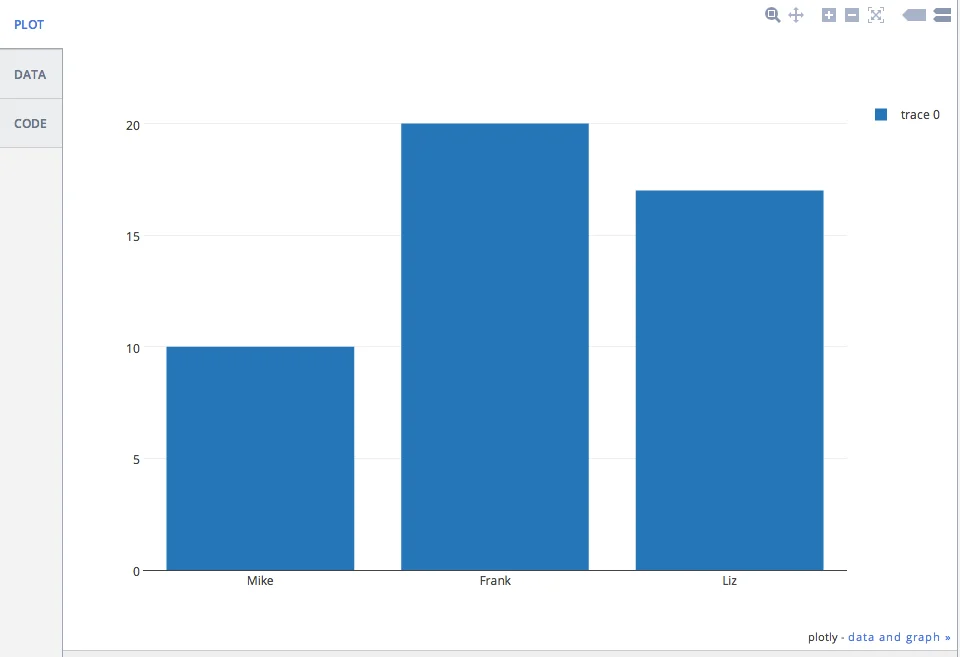
如果您收到此消息的 500 错误 - Aw, snap! Looks like you supplied the wrong API key. Want to try again? You can always view your key at https://plot.ly/api/key. When you display your key at https://plot.ly/api/key, make sure that you're logged in as realpython. - 您需要更新您的 API 密钥。
另外,如果这是一个真正的、面向客户端的应用程序,您会希望比这更优雅地处理错误。仅供参考。
群组分析
接下来,让我们看一个更复杂的示例,为以下队列分析统计数据创建图表:
| Cohort | 2011 | 2012 | 2013 | 2014 |
|---|---|---|---|---|
| 0 | 310 | 348 | 228 | 250 |
| 1 | 55 | 157 | 73 | 34 |
| 2 | 18 | 37 | 33 | 34 |
| 3 | 2 | 4 | 4 | 3 |
我们将基于同一个应用程序 - app.py 进行构建,但创建一个新文件:打开 app.py,然后“另存为”cohort.py。
首先升级到简单模板引擎,这样我们就可以将样式和 Javascript 文件添加到我们的模板中。添加一个名为“views”的新文件夹,然后在该目录中创建一个名为 template.tpl 的新文件。将以下代码添加到该文件中:
<!DOCTYPE html>
<html>
  <head>
    <meta charset="utf-8">
    <title>{{ title }}</title>
    <meta name="viewport" content="width=device-width, initial-scale=1.0">
    <link href="http://netdna.bootstrapcdn.com/bootstrap/3.0.0/css/bootstrap.min.css" rel="stylesheet" media="screen">
    <style>
      body {
        padding: 60px 0px;
      }
    </style>
  </head>
  <body>
    <div class="container">
      <h1>Graph via Plot.ly</h1>
      <form role="form" method="post" action="/plot">
        <table>
            <td>
              <h3>2011</h3>
              <div class="form-group" "col-md-2">
                <input type="number" name="Y01" class="form-control" placeholder="Cohort 0">
                <input type="number" name="Y02" class="form-control" placeholder="Cohort 1">
                <input type="number" name="Y03" class="form-control" placeholder="Cohort 2">
                <input type="number" name="Y04" class="form-control" placeholder="Cohort 3">
              </div>
            </td>
            <td>
              <h3>2012</h3>
              <div class="form-group" "col-md-2">
                <input type="number" name="Y11" class="form-control" placeholder="Cohort 0">
                <input type="number" name="Y12" class="form-control" placeholder="Cohort 1">
                <input type="number" name="Y13" class="form-control" placeholder="Cohort 2">
                <input type="number" name="Y44" class="form-control" placeholder="Cohort 3">
              </div>
            </td>
            <td>
              <h3>2013</h3>
              <div class="form-group" "col-md-2">
                <input type="number" name="Y21" class="form-control" placeholder="Cohort 0">
                <input type="number" name="Y22" class="form-control" placeholder="Cohort 1">
                <input type="number" name="Y23" class="form-control" placeholder="Cohort 2">
                <input type="number" name="Y24" class="form-control" placeholder="Cohort 3">
              </div>
            </td>
            <td>
              <h3>2014</h3>
              <div class="form-group" "col-md-2">
                <input type="number" name="Y31" class="form-control" placeholder="Cohort 0">
                <input type="number" name="Y32" class="form-control" placeholder="Cohort 1">
                <input type="number" name="Y33" class="form-control" placeholder="Cohort 2">
                <input type="number" name="Y34" class="form-control" placeholder="Cohort 3">
              </div>
            </td>
          </tr>
        </table>
        <button type="submit" class="btn btn-default">Submit</button>
      </form>
    </div>
    <script src="http://code.jquery.com/jquery-1.10.2.min.js"></script>
    <script src="http://netdna.bootstrapcdn.com/bootstrap/3.0.0/js/bootstrap.min.js"></script>
  </body>
</html>
您可能知道,这看起来就像一个 HTML 文件。不同之处在于我们可以使用语法 - {{ python_variable }} 将 Python 变量传递到文件。
创建 data.json 文件并添加您的 Plot.ly 用户名和 API 密钥。您可以在 此处 查看示例文件。
将以下代码添加到 cohort.py 中,以便在我们进行 API 调用时访问 data.json 以使用凭据:
import os
from bottle import run, template, get, post, request

import plotly.plotly as py
from plotly.graph_objs import *

import json

# grab username and key from config/data file
with open('data.json') as config_file:
    config_data = json.load(config_file)
username = config_data["user"]
key = config_data["key"]

py.sign_in(username, key)
现在我们不必将我们的密钥暴露给整个宇宙。只要确保使其不受版本控制即可。
接下来更新功能:
import os
from bottle import run, template, get, post, request

import plotly.plotly as py
from plotly.graph_objs import *

import json

# grab username and key from config/data file
with open('data.json') as config_file:
    config_data = json.load(config_file)
username = config_data["user"]
key = config_data["key"]

py.sign_in(username, key)


@get('/plot')
def form():
    return template('template', title='Plot.ly Graph')


@post('/plot')
def submit():
    # grab data from form
    Y01 = request.forms.get('Y01')
    Y02 = request.forms.get('Y02')
    Y03 = request.forms.get('Y03')
    Y04 = request.forms.get('Y04')
    Y11 = request.forms.get('Y11')
    Y12 = request.forms.get('Y12')
    Y13 = request.forms.get('Y13')
    Y14 = request.forms.get('Y14')
    Y21 = request.forms.get('Y21')
    Y22 = request.forms.get('Y22')
    Y23 = request.forms.get('Y23')
    Y24 = request.forms.get('Y24')
    Y31 = request.forms.get('Y31')
    Y32 = request.forms.get('Y32')
    Y33 = request.forms.get('Y33')
    Y34 = request.forms.get('Y34')

    trace1 = Scatter(
        x=[1, 2, 3, 4],
        y=[Y01, Y02, Y03, Y04]
    )
    trace2 = Scatter(
        x=[1, 2, 3, 4],
        y=[Y11, Y12, Y13, Y14]
    )
    trace3 = Scatter(
        x=[1, 2, 3, 4],
        y=[Y21, Y22, Y23, Y24]
    )
    trace4 = Scatter(
        x=[1, 2, 3, 4],
        y=[Y31, Y32, Y33, Y34]
    )

    data = Data([trace1, trace2, trace3, trace4])

    # api call
    plot_url = py.plot(data, filename='basic-line')

    return template('template2', title='Plot.ly Graph', plot_url=str(plot_url))

if __name__ == '__main__':
    port = int(os.environ.get('PORT', 8080))
    run(host='0.0.0.0', port=port, debug=True)
请注意 return 声明。我们传入模板的名称以及任何变量。让我们创建一个名为 template2.tpl 的新模板:
<!DOCTYPE html>
<html>
  <head>
    <meta charset="utf-8" />
    <title>{{ title }}</title>
    <meta name="viewport" content="width=device-width, initial-scale=1.0" />
    <link
      href="http://netdna.bootstrapcdn.com/bootstrap/3.0.0/css/bootstrap.min.css"
      rel="stylesheet"
      media="screen"
    />
    <style>
      body {
        padding: 60px 0px;
      }
    </style>
  </head>
  <body>
    <div class="container">
      <h1>Graph via Plot.ly</h1>
      <br />
      <a href="/plot"><button class="btn btn-default">Back</button></a>
      <br /><br />
      <iframe
        id="igraph"
        src="{{plot_url}}"
        width="900"
        height="450"
        seamless="seamless"
        scrolling="no"
      ></iframe>
    </div>
    <script src="http://code.jquery.com/jquery-1.10.2.min.js"></script>
    <script src="http://netdna.bootstrapcdn.com/bootstrap/3.0.0/js/bootstrap.min.js"></script>
  </body>
</html>
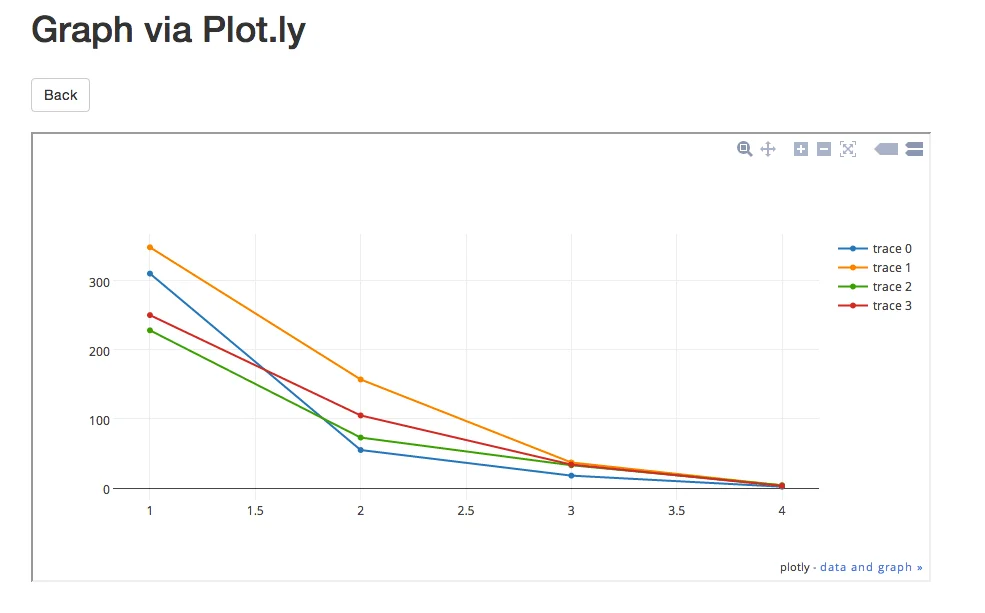
因此,iframe 允许我们更新表单,然后显示实际内容/图表以及更新后的更改。换句话说,我们不必离开站点即可查看图表。
运行。将值添加到表单中。然后提交。您的图表现在应如下所示:
结论
您可以从此存储库中获取所有文件。
下次见!
原文链接: